 By
By Most financial advice points you at the wrong lever. Earn more. Pick better funds. Shave a few basis points off your fees. All of it helps, but at the end of the day it’s not what decides when you get to stop working.
One number does that: the share of your income you actually keep. Your savings rate. It explains why two people with identical salaries and identical portfolios might retire years apart.
In this article, I walk through why that one number dominates everything else, what the maths actually looks like, and how I track it month over month in Lume, a private, offline-first FIRE tracker for Mac and iPhone.
What a savings rate actually is
The definition is simple:
Savings rate = (net income − expenses) ÷ net income
If you take home $4,000 a month and spend $2,500, you saved $1,500, and your savings rate is 37.5%.
Two details are worth getting right, because they are where most people quietly fool themselves.
Use net income, not gross. Some people compute their savings rate against their gross salary, which produces a flattering number that means nothing. You cannot invest money that never reached you. Lume takes either - type your gross salary and its deductions from the payslip, or take the net figure your statement shows - but the savings rate is always calculated on what actually landed in your account.
Count all of it as spending. Rent, groceries, the annual insurance premium, the holiday you paid for in instalments. If it left your net worth and did not go into an asset, it is an expense. Paying down debt principal is the one honest exception - that is net worth moving from one column to another.
Why it beats income and returns
Here is the part that makes savings rate different from every other financial metric: it moves both sides of the equation at once.
Raising your savings rate puts more money into your investments each month. That much is obvious. But the money you do not spend also lowers the finish line - because your FIRE number is a multiple of your annual spending. Under the 4% rule, every $100 of annual spending you cut removes $2,500 from the target you are trying to hit.
Income growth does not do that. A raise gives you a bigger numerator and leaves the target untouched - and if your spending rises with the raise, it can push the finish line further away while you feel like you are doing better. Investment returns do not do it either; they move one side only, and unlike your savings rate, you do not control them.
This is why the relationship between savings rate and time-to-FIRE is so steep. Starting from zero, assuming a 5% real return and a 4% withdrawal rate:
| Savings rate | Years to FIRE |
|---|---|
| 10% | 51 |
| 20% | 37 |
| 30% | 28 |
| 40% | 22 |
| 50% | 17 |
| 60% | 12 |
| 70% | 9 |
| 80% | 6 |
Notice that the table says nothing about salary. It does not need to. The years depend only on the ratio between what you save and what you spend, which is why this table works identically for someone earning $30,000 and someone earning $300,000.
One month is noise. Twelve months is a signal.
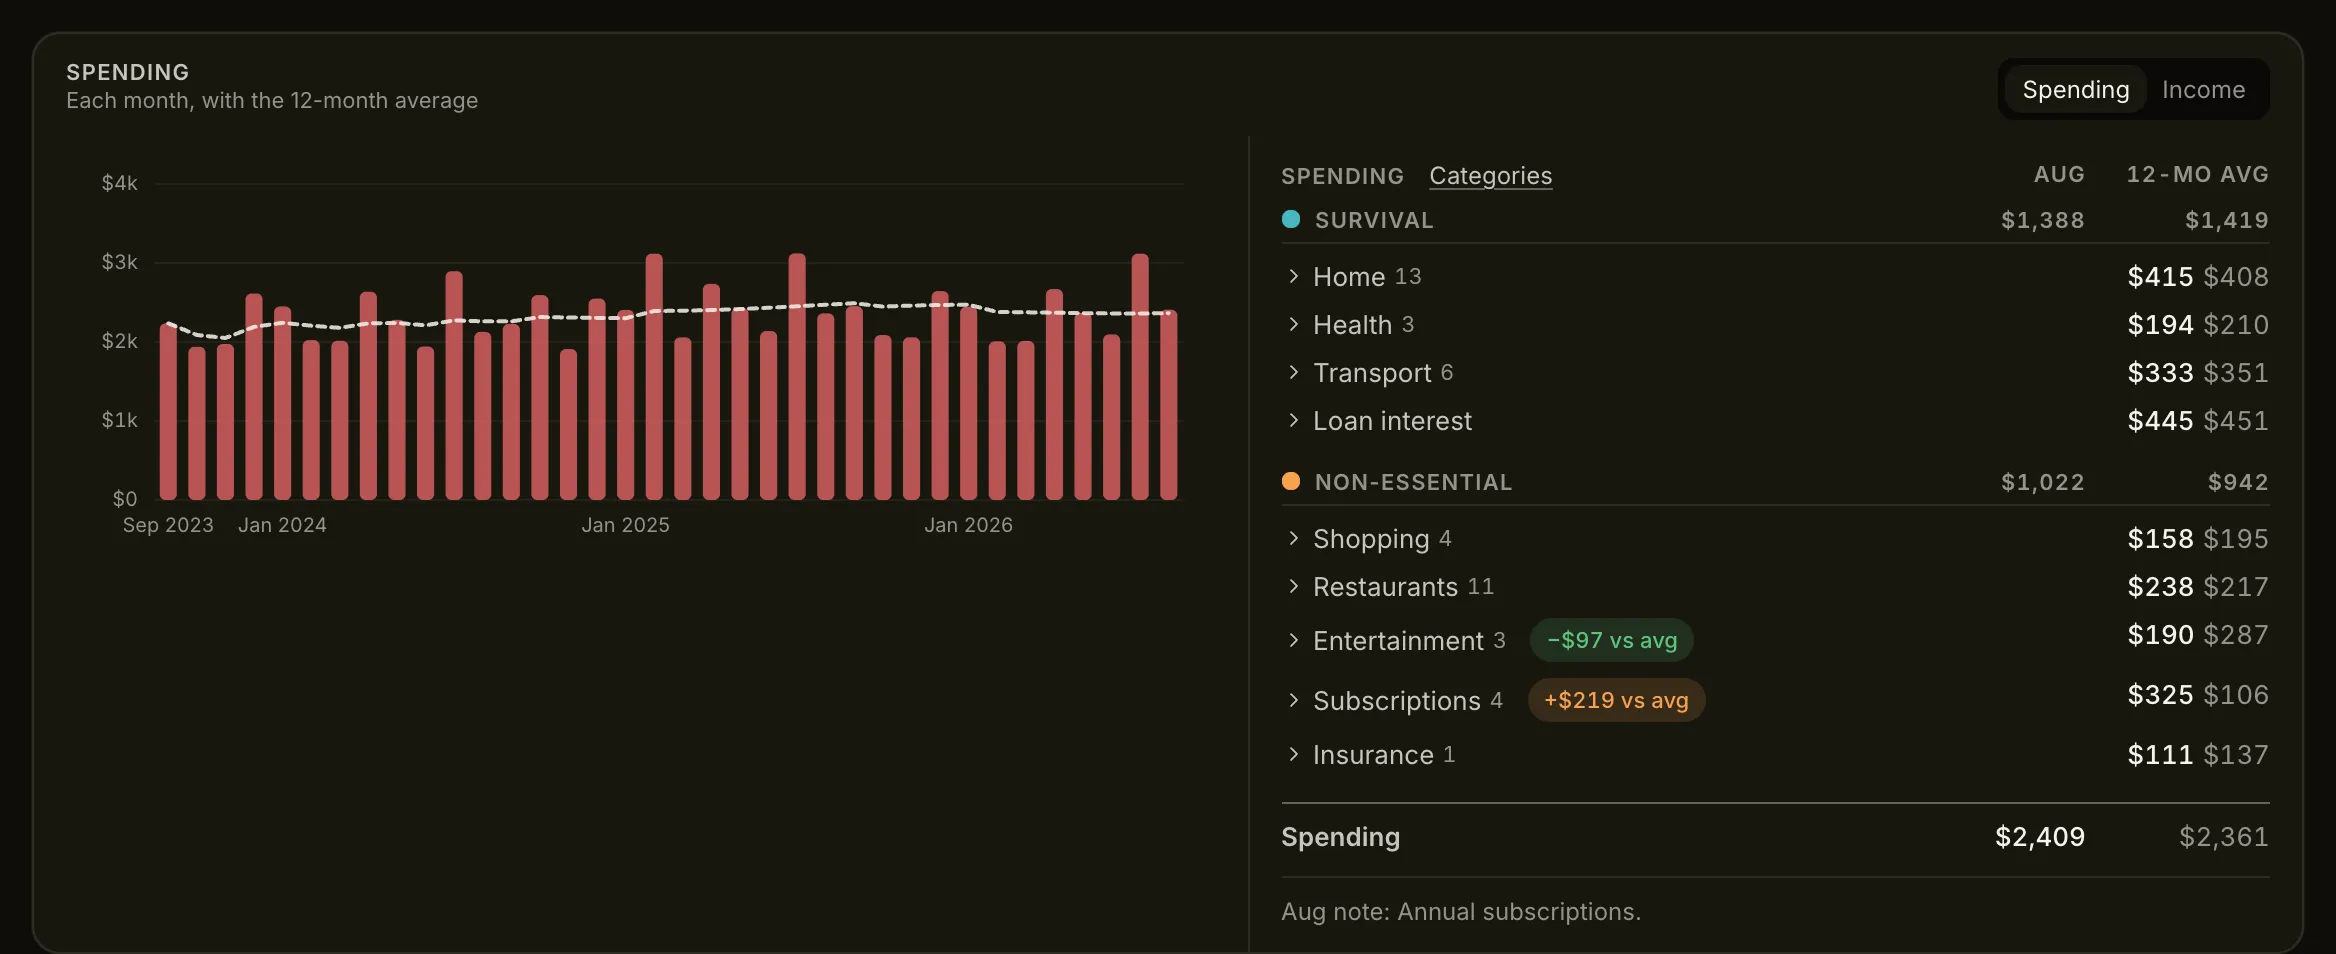
A single month’s savings rate is close to meaningless. December has presents in it. January has the annual insurance renewal. The month your bonus lands, your savings rate looks heroic; the month the car needs work, it looks like a disaster. Neither one tells you anything about your trajectory.
What matters is the trend, which is why Lume shows both. The spending chart on the dashboard - switch it to income for the other side - plots each month as a bar, with a 12-month average drawn over the top. The bars are the noise. The line is the signal, and the line is what you should react to. Beside the chart, each category’s month sits next to its own 12-month average, and one far from that average gets flagged.
Look at the gap in the screenshot above. The bars swing across roughly $1,200 - a summer holiday, Christmas, an annual insurance renewal - while the average line stays within about $230 of itself throughout. Read the bars and this household looks wildly inconsistent. Read the line and it is spending almost exactly the same amount year on year.
The one real bend in that line is a single large repair working its way through the window: it lifts the average, holds it up for twelve months, then drops out again. That is the behaviour you want from the number you steer by - responsive to a genuine change in how you live, unmoved by one bad month.
The same logic runs deeper than the charts. Lume computes your FIRE milestones from your 12-month average spending, not from last month’s total. So one expensive month does not move your finish line, and one frugal month does not earn you a false sense of progress - but a genuine change in how you live shows up within a few months and stays. It keeps the target honest.
Where to find your savings rate in Lume
The number surfaces in three places, at three different time horizons.
During the monthly close. Step 4 of the monthly close shows the month’s savings rate as you confirm it, alongside your net worth change and how the month moves your FIRE dates. This is the moment the number is most useful, because the reasons behind it are still fresh - you know exactly which category blew up.
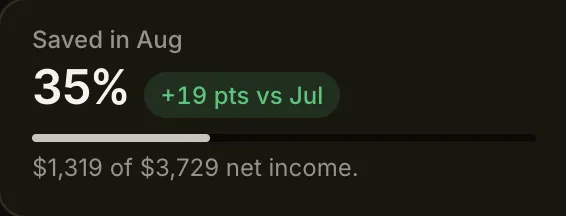
On the dashboard. The savings rate shows the current month’s figure, how many points it moved against last month, and what you kept out of your net income. A bar measures it against a target you set yourself - 50% by default, adjustable in Settings. Pick a target you can actually sustain; a number you miss every month stops being information and becomes background noise.
In Months. Every confirmed month leads with its savings rate, with what you saved beneath it, and each year totals its own - so you can scan several years of the habit in one screen and spot the stretches where things drifted.
When the number disappoints you
It will, at some point. A few things worth knowing when it does.
Go after expenses before income. Not because earning more is bad, but because expenses are the lever with two ends. Cutting $200 a month of recurring spending adds $200 to what you invest and removes $60,000 from your FIRE target. A $200 raise does the first thing only.
Use the survival split to find the room. Lume separates Survival spending from Non-essential spending for exactly this. Your survival number is largely structural - housing, food, insurance - and hard to move quickly. The non-essential number is where the actual decisions live, and seeing the two side by side tells you whether you have a lifestyle problem or a fixed-cost problem. They call for completely different responses.
Expect the early gains to be the big ones. Going from a 15% savings rate to 25% cuts about eleven years off your timeline. Going from 50% to 60% cuts about four. Both are worth having, but if your rate is currently low, the first improvements you make are worth more than any you will make later. That is the opposite of how it feels.
Do not chase returns to fix it. A disappointing savings rate is a spending or earning problem, and taking more portfolio risk to compensate substitutes a variable you control for one you do not.
Start tracking it this month
You do not need a forecasting model or a complicated spreadsheet. You need one honest number every month, and enough history behind it to see which way it is pointing.
Track it for a year and the relationship stops being theoretical: you watch the FIRE milestones move faster in the months you keep more, and you stop needing anyone to convince you the number matters. Getting Started covers the setup and your first close, which is where the number comes from.
General information, not financial advice. Your taxes, pension and circumstances will differ from the examples here. More on that.